

Price against score
Great deal At £1,149, it costs 51% less than the usual price for a score of 92 (£2,347).
Msi
9S7-13Q322-013
Office profile : an excellent choice.
Gaming profile : not well suited.
Summary
Excellent · Office profile
This model is an absolute exception in terms of mobility, weighing in at a featherweight of just 0.99 kg. Thanks to its highly efficient Intel Core Ultra 9 processor and 75 Wh battery, you can work all day without searching for a power outlet. The inclusion of 32 GB of RAM and 1 TB of storage ensures exemplary smoothness, even with dozens of tabs and documents open simultaneously.
Summary
Poor · Gaming profile
This machine is a very poor choice for anyone looking to play games. While the 1 TB of storage is top-tier for productivity, the graphics chip is far too weak to run modern titles smoothly. The 60 Hz screen further limits the responsiveness needed for gaming. It is a premium ultraportable, but it fails as a gaming laptop.
32 GB
LPDDR5
1 TB SSD
NVMe
13.3" OLED 2.8K
75 Wh Lithium polymer
Office score, out of 100.
Gaming score, out of 100.
Is today's best price fair? We compare it with what the market usually asks for an equivalent score, with what this model has cost before and with its other configurations.
Great deal!
Great deal At £1,149, it costs 51% less than the usual price for a score of 92 (£2,347).
Best score of the 34 products in its price band, £1,100–£1,200.
Better for the same pricePrice in the normal range.
Fair price At £1,149, it costs 9% more than the usual price for a score of 31 (£1,055).
Ranked 7 of 27 in its price band, £1,100–£1,200.
Better for the same priceWhere does each score come from? We break down what lifts it and what holds it back, then place the product in the catalogue, among all products and among those like it.
Great score!
Excellent for office work, lifted by a screen in the top 3% and its portability. What holds the score back: its everyday performance.
Could do better.
Inadequate for gaming, lifted by memory and storage in the best equipped 4%. What holds the score back: its graphics card.
| Sub-score | MSI Prestige AI Evo |
|---|---|
| 90/100 | |
| 93/100 | |
| 82/100 | |
| 95/100 | |
| 10/100 | |
| 70/100 | |
| 53/100 | |
| 93/100 |
| Sub-score | MSI Prestige AI Evo |
|---|---|
| Top 17%3,713 of 24,314 | |
| Top 3%536 of 24,160 | |
| Top 8%1,880 of 25,452 | |
| Top 8%423 of 25,400 | |
| Top 66%5,863 of 17,928 | |
| Top 24%4,149 of 20,754 | |
| Top 30%7,062 of 23,870 | |
| Top 4%443 of 25,459 |
| Sub-score | MSI Prestige AI Evo |
|---|---|
| Top 18%2,727 of 16,896 | |
| Top 3%312 of 16,359 | |
| Top 10%1,544 of 16,975 | |
| Top 9%349 of 16,936 | |
| Top 64%4,916 of 16,975 | |
| Top 25%3,581 of 16,975 | |
| Top 30%4,849 of 16,177 | |
| Top 5%379 of 16,963 |
| Sub-score | MSI Prestige AI Evo |
|---|---|
| Top 19%3,519 of 20,645 | |
| Top 3%398 of 19,971 | |
| Top 10%1,880 of 20,754 | |
| Top 8%395 of 20,704 | |
| Top 65%5,353 of 17,412 | |
| Top 24%4,149 of 20,754 | |
| Top 30%5,821 of 19,760 | |
| Top 5%412 of 20,737 |
| Sub-score | MSI Prestige AI Evo |
|---|---|
| Top 24%8 of 36 | |
| Top 6%3 of 39 | |
| Top 6%3 of 39 | |
| Top 4%1 of 39 | |
| Top 69%12 of 29 | |
| Top 34%6 of 34 | |
| Top 40%16 of 39 | |
| Top 1%1 of 39 |
Excellent
Whole catalogue · 23,137 top 12%
scored for gaming · 15,383 top 13%
scored for office work · 18,838 top 13%
£1,100–£1,200 · 39 top 4%
the middle half median this model (32 GB)
Good
Whole catalogue · 20,754 better than 68%
scored for gaming · 16,975 better than 67%
£1,100–£1,200 · 34 better than 47%
the middle half median this model (Intel Core Ultra 9 288V, 58/100)
Excellent
Whole catalogue · 22,975 top 16%
scored for gaming · 15,280 top 18%
scored for office work · 18,719 top 17%
£1,100–£1,200 · 39 top 17%
the middle half median this model (1,024 GB)
Excellent
Whole catalogue · 20,831 top 1%
scored for gaming · 14,301 top 1%
scored for office work · 17,369 top 1%
£1,100–£1,200 · 31 top 6%
the middle half median this model (0.99 kg)
Weak
Whole catalogue · 17,928 better than 34%
scored for gaming · 16,975 better than 36%
scored for office work · 17,412 better than 35%
£1,100–£1,200 · 29 better than 31%
the middle half median this model (10/100)
Weak
Whole catalogue · 17,928 better than 34%
scored for gaming · 16,975 better than 36%
scored for office work · 17,412 better than 35%
£1,100–£1,200 · 29 better than 31%
the middle half median this model (10/100)
Good
Whole catalogue · 20,754 better than 76%
scored for gaming · 16,975 better than 75%
£1,100–£1,200 · 34 better than 66%
the middle half median this model (Intel Core Ultra 9 288V, 70/100)
Good
Whole catalogue · 12,384 better than 76%
scored for gaming · 8,731 better than 75%
scored for office work · 10,667 better than 76%
£1,100–£1,200 · 25 top 10%
the middle half median this model (75 Wh)
No reviews yet: be the first to write one.
| Product | ||||||||
|---|---|---|---|---|---|---|---|---|
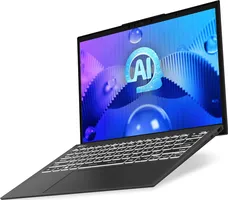 MSI Prestige AI Evo
current
Msi |
92
|
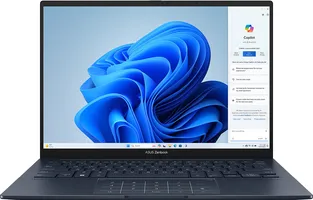
£1,149 | Intel Core Ultra 9 288V | - | 32 GB LPDDR5 | 13.3" OLED 2.8K | 75 Wh Lithium polymer | 1 TB SSD |
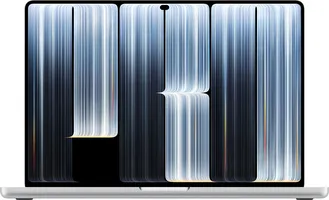 MacBook Pro 16" M5 Pro
Apple |
95
|
£2,599 | Apple M5 Pro 18 Core | Apple M5 Pro 20-core GPU | 48 GB DDR | 16.2" OLED Liquid Retina XDR 120 Hz | 100 Wh Lithium polymer | 1 TB SSD |
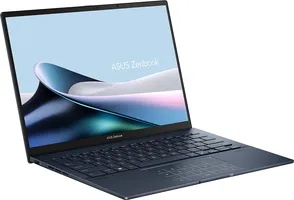
 ASUS Zenbook 14 OLED
Asus |
88
|
£988 | Intel Core Ultra 9 285h | Intel Arc 140T Graphics | 32 GB LPDDR5X | 14" OLED 3K 120 Hz | 75 Wh Lithium-ion | 1 TB SSD |
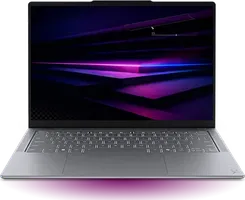
 Lenovo ThinkBook 16p Gen 6
Lenovo |
82
|
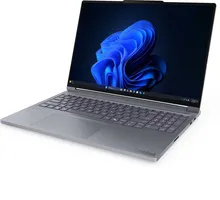
£3,274 | Intel Core Ultra 9 275hx | NVIDIA GeForce RTX 5060 Laptop GPU | 32 GB DDR5 | 16" IPS 3.2K 165 Hz | 85 Wh Lithium polymer | 1 TB SSD |
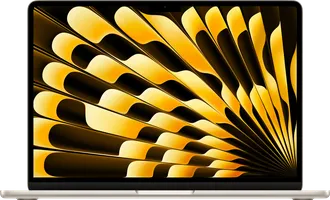
 MacBook Air 13" M5
Apple |
86
|
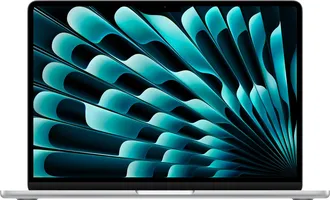
£1,149 | Apple M5 10 Core | Apple M5 8-core GPU | 16 GB DDR | 13.6" IPS Liquid Retina | 53.8 Wh Lithium polymer | 512 GB SSD |
 Lenovo Legion 5 Gen 10
Lenovo |
76
|
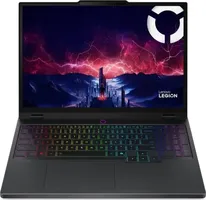
£1,602 | AMD Ryzen AI 7 350 | NVIDIA GeForce RTX 5060 Laptop GPU | 32 GB DDR5 | 15.1" OLED WQXGA 165 Hz | 80 Wh Lithium-ion | 1 TB SSD |
Lorem ipsum
Score
Key specs
With a free account: